According to a survey, 96% of metric-driven companies that set and track their KPIs meet some of their targets, while 41% achieve all their targets. In the architecture industry, Key Performance Indicators (KPIs) are essential tools for measuring the success and efficiency of projects and overall business operations. These metrics provide valuable insights that help firms optimize their processes, improve client satisfaction, and maintain a competitive edge. Understanding and implementing the right KPIs can transform an architecture firm’s performance and drive long-term success. This blog explores the most crucial KPIs in architecture, highlighting their significance and how they can be effectively utilized.
KPIs that Matter in Architecture
Project Delivery Time

Project delivery time is one of the critical KPIs in architecture. This measures the duration from the initial project kickoff to its completion. Timely delivery is crucial as delays can lead to increased costs, client dissatisfaction, and potential loss of future business. Moreover, meeting deadlines is a clear indicator of an architecture firm’s efficiency and reliability. It reflects the firm’s ability to manage resources, coordinate teams, and navigate project challenges effectively.
How to Measure
Track the planned versus actual completion dates of projects. Furthermore, analyze the reasons for any delays to identify areas for improvement. It’s best to implement project management software to monitor progress and set realistic timelines. To measure Project Delivery Time, you can use the following formula:
Project Delivery Time=Actual Completion Date−Planned Completion Date
This formula calculates the difference between the planned completion date and the actual completion date. Here’s how you can implement and interpret it:
- Planned Completion Date: The date by which the project is scheduled to be completed.
- Actual Completion Date: The date on which the project is actually completed.
Steps to Use the Formula:
- Identify Dates:
- Determine the planned completion date for the project.
- Record the actual completion date once the project is finished.
2. Calculate the Difference:
- Subtract the planned completion date from the actual completion date.
Example:
- Planned Completion Date: October 31, 2024
- Actual Completion Date: November 10, 2024
Using the formula:
Project Delivery Time=November 10, 2024−October 31, 2024
Project Delivery Time=10 days late
If the result is positive, the project was completed later than planned, indicating a delay. On the other hand, if the result is negative, the project was completed earlier than planned, indicating it was ahead of schedule. Lastly, if the result is zero, the project was completed exactly on time.
Budget Adherence
Staying within budget is vital for maintaining profitability and client trust. Overruns, on the other hand, can strain the firm’s finances and damage its reputation. Budget adherence measures how well a project stays within its allocated budget. This includes tracking all expenses and comparing them to the initial budget estimates.
How to Measure
Monitor all project-related expenditures and compare them against the initial budget. Use financial management software to track and report expenses in real time. To measure Budget Adherence, you can use this formula:
Budget Adherence = (Actual Budget/Planned Budget) ×100%
This formula will show you the percentage of the actual budget used compared to the planned budget. The planned budget is the total amount of money allocated for the project while the actual budget is the total amount of money actually spent on the project.
Steps to Use the Formula:
- Identify Budget Values:
- Determine the planned budget for the project.
- Record the actual expenditures once the project is completed.
2. Calculate the Budget Adherence:
- Divide the actual budget by the planned budget.
- Multiply the result by 100 to get the percentage.
Example:
- Planned Budget: $500,000
- Actual Budget: $550,000
Using the formula:
Budget Adherence = (550,000/500,000) ×100%
Budget Adherence = 110%
If the result is 100%, this means that the project was completed exactly within the planned budget. However, if the result is greater than 100%, the project exceeded the planned budget. This indicates a budget overrun. Lastly, if the result is less than 100%: The project was completed under the planned budget. This indicates cost savings.
By consistently applying this formula and analyzing the results, architecture firms can improve their financial management processes, reduce budget overruns, and enhance overall profitability and client trust.
Client Satisfaction
Satisfied clients will more likely trust you and return for future projects. Additionally, they will more likely refer your firm to others. Client satisfaction is a subjective but invaluable KPI that gauges the overall happiness of clients with the delivered project. This can be assessed through client feedback, surveys, and repeat business. What’s more, high client satisfaction is a strong indicator of the firm’s ability to meet or exceed client expectations.
How to Measure
After conducting regular client satisfaction surveys with survey scores and collecting feedback throughout and after the project, use this simple formula to measure Client Satisfaction:
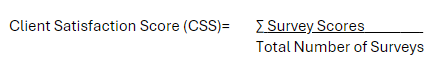
Steps to Use the Formula:
- Collect Survey Scores:
- Conduct client satisfaction surveys and collect scores for each survey.
2. Calculate the Average Score:
- Sum all the survey scores.
- Divide the total by the number of surveys conducted.
Example:
- Survey Scores: 8, 9, 7, 10, 9
- Number of Surveys: 5
Using the formula:
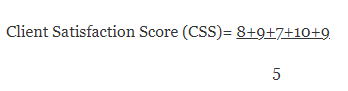
Client Satisfaction Score (CSS)= 43/ 5 = 8.6
Design Quality

Design quality evaluates the aesthetic and functional aspects of a project. What’s more, high-quality designs enhance the firm’s reputation and increase client satisfaction. This KPI considers how well the design meets the client’s requirements and adheres to industry standards.
How to Measure
Use peer reviews, client feedback, and industry awards as indicators of design quality. Additionally, conduct post-occupancy evaluations to assess how well the design meets user needs. Lastly, implement internal quality control processes to maintain high design standards.
Resource Utilization
Efficient resource utilization minimizes waste and maximizes productivity, leading to cost savings and timely project completion. Therefore, it measures how effectively the firm uses its resources, including human resources, materials, and equipment. When you have a high resource utilization, it means you also have efficient project management.
How to Measure
Track the usage rates of resources against their availability. Here’s a formula you can use to measure resource utilization:
Resource Utilization (%) = (Actual Resource Usage/Available Resource Capacity)×100
Steps to Use the Formula:
- Identify Resource Usage:
- Determine the actual amount of resources used during a specific period.
2. Identify Available Capacity:
- Determine the total available capacity of the resources for the same period.
3. Calculate Resource Utilization:
- Divide the actual resource usage by the available resource capacity.
- Multiply the result by 100 to get the percentage.
Example:
- Actual Resource Usage: 80 hours
- Available Resource Capacity: 100 hours
Using the formula:
Resource Utilization (%) = (80/100) ×100
Resource Utilization (%) = 80%
A high percentage means efficient use of resources. On the other hand, a low percentage means there’s an underutilization of resources. Therefore, the latter suggests potential inefficiencies or overcapacity. This formula helps architecture firms monitor and optimize the use of their resources, leading to better project management and cost savings.
Safety Performance
Architectural design flaws may pose safety risks. With safety performance KPI, safety measures and protocols implemented on construction sites will be assessed. Moreover, flaws in designs can also be identified. Measuring this KPI includes tracking incidents, accidents, and near misses.
How to Measure
Here’s a simple formula to measure safety performance based on the incident rate:
Safety Incident Rate = (Number of Incidents/Total Hours Worked) ×200,000
Steps to Use the Formula:
- Identify the Number of Incidents:
- Count the total number of safety incidents (including accidents and near misses) during a specific period.
2. Calculate Total Hours Worked:
- Sum the total hours worked by all employees during the same period.
3. Calculate the Safety Incident Rate:
- Divide the number of incidents by the total hours worked.
- Multiply the result by 200,000 (a standard base for calculating incident rates to normalize the data).
Example:
- Number of Incidents: 5
- Total Hours Worked: 100,000 hours
Using the formula:
Safety Incident Rate= (5/100,000) ×200,000
Safety Incident Rate=0.00005×200,000=10
A lower rate means better safety performance while a higher rate indicates poorer safety performance and a need for improved safety measures.
Profit Margin
Profit margin measures the financial performance of a project by calculating the difference between the project’s revenues and costs. It provides insight into the firm’s profitability. Maintaining healthy profit margins is essential for the firm’s financial stability and growth because it allows for reinvestment in resources, technology, and talent.
How to Measure
Here’s a simple and straightforward formula to measure profit margin:
Profit Margin (%) = (Net Profit/Revenue) ×100
Steps to Use the Formula:
- Identify Revenue:
- Determine the total revenue generated by the project.
2. Identify Net Profit:
- Determine the net profit by subtracting total costs from total revenue.
3. Calculate the Profit Margin:
- Divide the net profit by the revenue.
- Multiply the result by 100 to get the percentage.
Example:
- Revenue: $500,000
- Total Costs: $350,000
- Net Profit: $500,000 – $350,000 = $150,000
Using the formula:
Profit Margin (%) = (150,000/500,000) ×100
Profit Margin (%) =0.3×100= 30%
To sum it up, a higher percentage indicates a more profitable project. A lower percentage, on the other hand, indicates lower profitability and potential areas for cost optimization.
Change Order Frequency
Change order frequency tracks the number of changes made to the original project scope, design, or specifications during its execution. Frequent changes can indicate issues in project planning or client communication. Therefore, it is important to minimize change orders. It helps maintain project timelines and budgets. What’s more, it reflects the firm’s ability to deliver as per the initial agreement, enhancing client trust.
How to Measure
Record and analyze all change orders, identifying their causes and impacts. After doing so, use this simple and straightforward formula to measure Change Order Frequency:
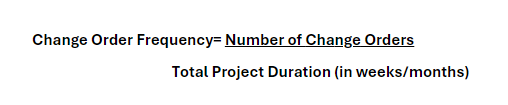
Steps to Use the Formula:
- Identify the Number of Change Orders:
- Count the total number of change orders issued during the project.
2. Determine Total Project Duration:
- Measure the duration of the project from start to finish in weeks or months.
3. Calculate the Change Order Frequency:
- Divide the total number of change orders by the project’s overall duration.
Example:
- Number of Change Orders: 10
- Total Project Duration: 5 months
Using the formula:
Change Order Frequency= 10/5= 2
Having a higher frequency means frequent changes, suggesting potential issues in initial planning or client communication. Lower frequency, on the other hand, indicates fewer changes, reflecting better initial planning and clearer client communication.
Employee Satisfaction and Retention

Employee satisfaction and retention measure the happiness and stability of the firm’s workforce. High employee satisfaction leads to better performance, creativity, and reduced turnover rates.
How to Measure
To measure employee satisfaction, conduct regular employee surveys and feedback sessions. For retention, here’s a straightforward formula to measure it:
![]()
![]()
Steps to Use the Formula:
- Identify Number of Employees at Start of Period:
- Tally the total number of employees at the start of the period.
2. Identify Number of Employees at End of Period:
- Count the total number of employees at the end of the period.
3. Identify Number of New Hires:
- Record the number of new employees hired during the period.
4. Calculate the Employee Retention Rate:
- Subtract the number of new hires from the total number of employees at the end of the period.
- Divide this result by the number of employees present at the start of the period.
- Multiply by 100 to get the percentage.
Example:
- Number of Employees at Start of Period: 100
- Number of Employees at End of Period: 95
- Number of New Hires: 5
Using the formula:
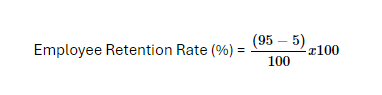
Employee Retention Rate (%) = (90/100) ×100 = 90 %
When you get a higher percentage, this means better employee retention and likely higher satisfaction. A lower percentage, on the other hand, indicates higher turnover, suggesting potential issues with employee satisfaction. Therefore, always monitor turnover rates and analyze the reasons for employee departures to come up with a more effective solution.
Environmental Impact
Environmental impact assesses the sustainability of the firm’s projects. It includes measuring carbon footprint, waste generation, and resource efficiency. To achieve a positive environmental KPI, firms should adopt sustainable practices such as using energy-efficient materials, implementing green building techniques, and prioritizing renewable energy sources.
Incorporating features like solar panels, rainwater harvesting systems, and green roofs can significantly reduce a building’s carbon footprint and resource consumption. Additionally, conducting regular energy audits, optimizing waste management, and sourcing local, sustainable materials contribute to minimizing environmental impact.
By consistently applying these strategies and monitoring their effectiveness, architecture firms can enhance their sustainability profile, comply with environmental regulations, and demonstrate their commitment to creating eco-friendly designs.
How to Measure
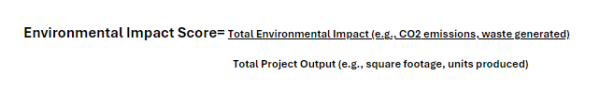
To measure your environmental impact KPI, use tools and metrics to calculate the environmental impact of projects. Here’s an example of a simple and straightforward formula to measure your environmental impact on CO2 emissions:
Steps to Use the Formula:
- Identify Total Environmental Impact:
- Measure the total environmental impact, such as CO₂ emissions (in metric tons) or waste generated (in kilograms).
2. Determine Total Project Output:
- Measure the project’s total output, such as the square footage of the building or the number of units produced.
3. Calculate the Environmental Impact Score:
- Divide the total environmental impact by the total project output.
Example:
- Total CO₂ Emissions: 500 metric tons
- Total Project Output: 100,000 square feet
Using the formula:
Environmental Impact Score= 500 metric tons/100,000 square feet = 0.005 metric tons/square foot
Getting a lower score means better environmental performance and higher sustainability while a higher score indicates higher environmental impact. Thus, getting the latter suggests a need for improved sustainable practices.
BizForce Helps Firms Track Crucial KPIs

BizForce, a leading architecture staffing company, can help firms implement and track crucial KPIs to significantly improve their performance and reputation. By providing skilled professionals adept at managing project delivery time, budget adherence, client satisfaction, design quality, resource utilization, and profit margins, BizForce ensures that firms meet their goals and exceed client expectations. This support allows architecture firms to regularly review and refine their KPIs, staying competitive and successful in an ever-evolving industry. Incorporating these KPIs requires commitment and strategic planning, but with BizForce’s expertise and data-driven insights, firms can optimize their processes, enhance their services, and achieve sustainable growth.
Conclusion
Implementing and tracking these KPIs can significantly improve the performance and reputation of architecture firms. By focusing on project delivery time, budget adherence, client satisfaction, design quality, resource utilization, safety performance, profit margins, change order frequency, employee satisfaction, and environmental impact, firms can ensure they meet their goals and exceed client expectations. Regularly reviewing and refining these KPIs will help architecture firms stay competitive and successful in an ever-evolving industry.
Incorporating these KPIs into your firm’s operations requires commitment and strategic planning, but the benefits far outweigh the effort. By harnessing the power of data-driven insights, architecture firms can optimize their processes, enhance their services, and ultimately achieve sustainable growth.
Don’t wait—take the first step towards transforming your business and achieving your goals with BizForce! Contact us here.